(www.hyperprobe.co)
A useful adjunct to this kind of production in-memory debugging is a read-only agent locked down role in AWS or equivalent. I believe amazon has just set up some kind of a wizard for configuring a role like this. It really gives agents the ability to relatively safely look at the prod setup without exposing sensitive details or making changes, especially with e.g. terraform
If you don’t know how it broke, and you don’t know how you fixed it, what exactly is it you think you understand about your application?
what we wanted to convey is that sometimes people confuse "the symptom went away" with "the root cause was fixed"
I have seen that a rollback, a quick redeploy, or a temporary drop in tenant load makes the alerts go away and issue is considered resolved. specially true for larger teams with many engineers and services
a real example: a dev got OOMed after a release that coincided with a flash sale. he increased memory limits, and containers stopped crashing and it was "fixed". Actualy, a newly introduced internal module had a memory leak. adding RAM just hid the leak until the next traffic spike.
hyperprobe exists to capture actual in-memory runtime state during live traffic so you can prove the root cause before changing code or scaling infra in this case
But when the pipeline fails (bugs happen that's fine) re-running the exact same process may not be the solution.
Where does the additional intelligence that wasn't there before come from? We ran the pipeline that got it to prod on the same exact models you have access to. So the value prop is that you read the logs automatically instead of a developer directing a debug session?
your coding agent will have access to your code and can see what logs you have enabled, if indeed that would help in debugging, going that route helps. it can take your agents a bunch of retries but it might get there if the answer is in logs
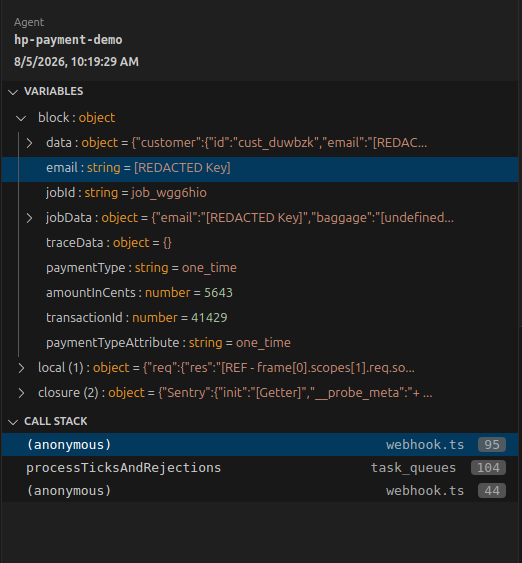
what we provide your coding agent is a detailed snapshot of all your variables at any line it feels would help debugging. and not just in the current call frame.. even the variables of the callers of your current function, like a debugger.
suupose funcA() -> funcB() -> funcC() -> yourCurrentFn()
we'll provide all the variables that were set in all 4 functions to your agent. debugging using this would be a lot more accurate and you just one snapshot like this instead of looking at a thousand log lines to understand why something is not working the way you want to.
this kind of data is missing from your logs and and even your traces because it will be impractical for privacy and performance.
Consider putting this near the beginning rather than 2/3 of the way down your pitch. I nearly stopped reading because these dramatic 1-2 sentence paragraphs are unpleasantly like listening to TV commercials. I think your target audience should not be CTOs or their direct reports, but engineers themselves, and I think you need a more focused pitch that takes less time to get to the point.
Anyway, an MCP-managed passive debugger seems like a useful tool. Best of luck with it.
For people that don't have these neat observability tools (like me), I've been using https://shellshare.net (disclaimer: I made it).
This is a single command to share a terminal live with e2e encryption. Originally it was for teaching classes or helping colleagues, but it's also very helpful for agents. I SSH into prod and run:
> npx shellshare exec --json -- tail /var/log/my-app.log
This generates a URL, then I can tell any agent:
> monitor <URL>, instructions in https://shellshare.net/llms.txt
They can see the output live. No need to install anything in the agent's machine. Next shellshare version it will be just "monitor <URL>" and the agent's instructions will be in the URL itself.
Nothing even near what you've guys done, but it has been helpful for me. Best of luck in your startup!
It could work, the technology isnt the limitation.
But we were clear from day one that we cant let our sdks change the memory. Even if it helped solve a real problem.. say for example resetting a bad env variable or a feature flag without redeployment.
I might be biased from my experience, but i would prefer having a bug in my system for longer that i can reliably reason with than having it solved dynamically within the app which adds another thing to keep in my mind.
for me, bug -> fails -> good bug + dynamic patch -> works -> bad
also we dont think that we ourselves wont have any downtime ever, so we design for it. we'd not want to become as critical for your app as say your database.
As of now, your app works even if our servers are down/blocked/slow, adding the ability to change memory on the fly could change this
You're correct, serverless is a bit tricky. CPU gets suspended the moment your function returns. The way it works is that you wrap your functions with a wrapper in our sdk.
that wrapper is supposed to track if there's telemetry to be sent, if so.. it sends it, otherwise, return as usual
this makes sure that when there's no active probe, there's no latency added. But when there's an active probe.. ~100-200ms could be added in the worst case if the probe is just before the return.
again, this isnt a problem in non serverless worloads because the CPU is always on.
but since probes are bounded by time and count, this will go away as soon as the time or count condition meets. beats adding new logs and redeploying in my opinion
How does the probe function technically. Inspector API I believe is unavailable on CloudFlare etc.
I once wrote something like this which could work on serverless platforms without the Inspector API. It used Typescript AST transforms to insert no-op listeners at every line, so they would dynamically eval or dump breakpoint style if a listenToLine parameter equalled their line, otherwise no-op. So trivial but not technically zero runtime cost.
makes no difference if its cold or warm start. (The latency because of us, not latency in general)
Using AST, that's clever actually! I thought along somewhat similar lines. User tree-sitter. But it needs a build step! not sure how people feel about that :D It changes your source code itself so we'd need a 2 tiered source resolution. Dirty, but doable.
And instead of having this at every line, i did this at "lines of interest" before and after every scope ends.
so at the start/end of an if condition, start/end of fn definiton. it sort of worked, but it slowed down our synthetic benchmarks for "no effect when probes arent there" by more than what i wanted to tolerate and it depended of eval which i thought devs wont accept. and using node-vm slowed it further
But will give another try again. thanks for sharing this!
If you are transforming anyway you're looking at virtually zero dev time cost and runtime cost when no probe is active of less than 1 ms.
This approach survives any environment I know of and has almost zero runtime cost.
How does it work? Using the NodeJs inspector API or other language equivalent to drop breakpoints? Those APIs are unavailable in many serverless environments and are challenging to use alongside bundlers.
You're correct inpector API is not available in many non-v8 targets. Bun also has somewhat of a partial support for inpector API but at least has a programmable debugger interface. It's not going to be as fast as native inspector but its better than nothing i guess :P
for python sys.monitoring. for JVM, we do bytecode manipulation itself.
bundlers are not an issue because we support sourcemaps. We just need mappings, not code in the sourcemaps and we do sourcemap resolutions out of process so that your app doesnt spend ~200 MB of memory for parsing sourcemaps
all the rules get compiled into a single regex pattern, that lets us save on iterations.
https://i.postimg.cc/jSmRpnRX/Screenshot-from-2026-08-05-10-...